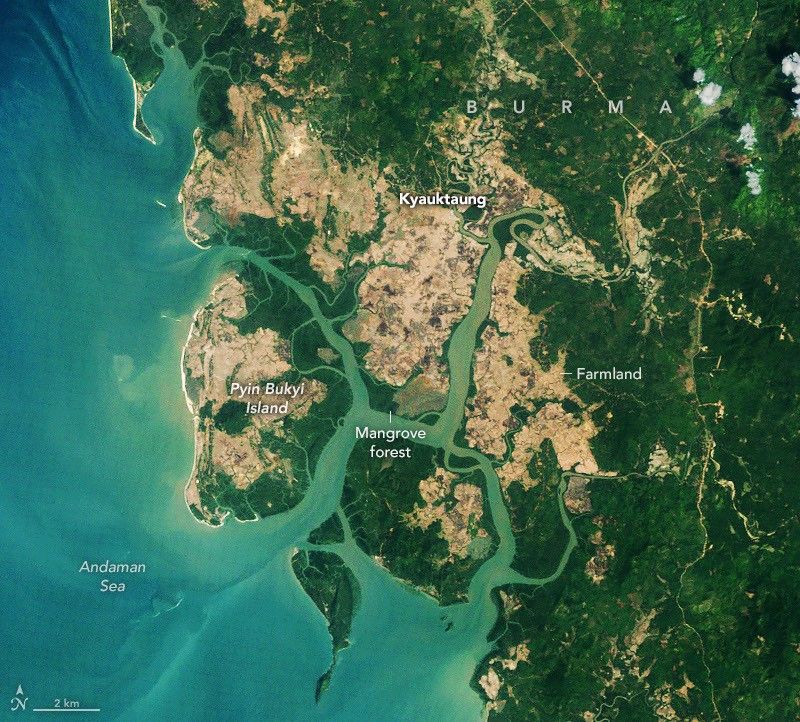
Earth Observatory Science Earth Observatory A Global Rebound for Mangroves Earth Earth Observatory Image of the Day EO Explorer Topics All Topics Atmosphere Land Heat & Radiation Life on Earth Human Dimensions Natural Events Oceans Remote Sensing Technology Snow & Ice Water More Content Collections Global Maps World of Change Articles Earth Matters Blog Blue Marble: Next Generation EO Kids Mission: Biomes About About Us Subscribe 🛜 RSS Contact Us Search 2010 2026 NASA Earth Observatory/Michala Garrison NASA Earth Observatory/Michala Garrison 20102026 NASA Earth Observatory/Michala Garrison NASA Earth Observatory/Michala Garrison 2010 2026 CurtainToggle2-Up Image Details Mangroves have replaced rice fields in parts of Burma’s Myeik District.
Table of Contents
The Bigger Picture
The TM (Thematic Mapper) on Landsat 5 captured the image on the left on February 14, 2010, and the OLI on Landsat 9 captured the image on the right on February 2, 2026.NASA Earth Observatory images by Michala Garrison.
What We Know So Far
- Scientists began using satellites to map mangrove forests in the 1970s after the launch of the first Landsat satellite.
- For decades, the story they told about mangroves was dominated by loss and decline.
- Research published in Science suggests that the tide has turned.
- A global rebound began around 2010, the scientists found, led by the expansion of mangrove forests in Asia, Australia, and South America.
- The researchers analyzed Landsat imagery collected between 1984 and 2023, looking for signs of changes in the extent and density of mangrove canopy.
- They tallied losses of nearly 3,000 square kilometers (1,200 square miles) between 1984 and 2010, followed by an unexpected increase of nearly 2,000 square kilometers (770 square miles) of mangroves after 2010.
- They also found that many of today’s mangrove forests have denser, more closed canopies than they did in 2010, a sign of healthier, less degraded forests, particularly in South America.
- “Other research groups have mapped and analyzed long-term changes in select regions, but these are the first global mangrove maps that cover such a long period,” said Zhen Zhang, an environmental scientist at Tulane University.
- “About two-thirds of the expansion was due to mangroves colonizing new areas and the other third due to restoration and regrowth in degraded areas,” he added.
- One of the most notable reversals occurred in Southeast Asia—especially Burma (Myanmar).
What Comes Next
Ongoing coverage will track developments as new information becomes available from official and independent sources.
Impact & Analysis
Analysts suggest that the underlying factors driving this change are rooted in evolving consumer behaviors and shifting economic pressures. As the situation develops, further analysis will be required to fully understand the broader implications for A Global Rebound for Mangroves.
Timeline
- Initial update published by source.
- Key details emerged in follow-up reporting.
- Further confirmation expected in upcoming official statements.
Background Context
Earth Observatory Science Earth Observatory A Global Rebound for Mangroves Earth Earth Observatory Image of the Day EO Explorer Topics All Topics Atmosphere Land Heat & Radiation Life on Earth Human Dimensions Natural Events Oceans Remote Sensing Technology Snow & Ice Water More Content Collections Global Maps World of Change Articles Earth Matters Blog Blue Marble: Next Generation EO Kids Mission: Biomes About About Us Subscribe 🛜 RSS Contact Us Search 2010 2026 NASA Earth Observatory/Michala Garrison NASA Earth Observatory/Michala Garrison 20102026 NASA Earth Observatory/Michala Garrison NASA Earth Observatory/Michala Garrison 2010 2026 CurtainToggle2-Up Image Details Mangroves have replaced rice fields in parts of Burma’s Myeik District. The TM (Thematic Mapper) on Landsat 5 captured the image on the left on February 14, 2010, and the OLI on Landsat 9 captured the image on the right on February 2, 2026.NASA Earth Observatory images by Michala Garrison. Scientists began using satellites to map mangrove forests in the 1970s after the launch of the first Landsat satellite. For decades, the story they told about mangroves was dominated by loss and decline. Research published in Science suggests that the tide has turned. A global rebound began around 2010, the scientists found, led by the expansion of mangrove forests in Asia, Australia, and South America. The researchers analyzed Landsat imagery collected between 1984 and 2023, looking for signs of changes in the e
Quick FAQ
Q: What is the key update?
Earth Observatory Science Earth Observatory A Global Rebound for Mangroves Earth Earth Observatory Image of the Day EO Explorer Topics All Topics Atmosphere Land Heat & Radiation Life on Earth Human Dimensions Natural Events Oceans Remote Sensing Technology Snow & Ice Water More Content Collections Global Maps World of Change Articles Earth Matters Blog Blue Marble: Next Generation EO Kids Mission: Biomes About About Us Subscribe 🛜 RSS Contact Us Search 2010 2026 NASA Earth Observatory/Michala Garrison NASA Earth Observatory/Michala Garrison 20102026 NASA Earth Observatory/Michala Garrison NASA Earth Observatory/Michala Garrison 2010 2026 CurtainToggle2-Up Image Details Mangroves have replaced rice fields in parts of Burma’s Myeik District.
Q: What should readers watch next?
Watch for verified numbers, official reactions, and timeline changes.
Source: NASA – Original Link
Source: NASA

